The 1901 Census
The study of the McClure surname in Ulster begins with
the 1901 Census. Because of the four courts fire many
valuable genealogical resources were lost. Fortunately
the 1901 and 1910 Census survived and provide us with
a wide range of information which may assist in
identifying the areas of early settlement in Ulster.
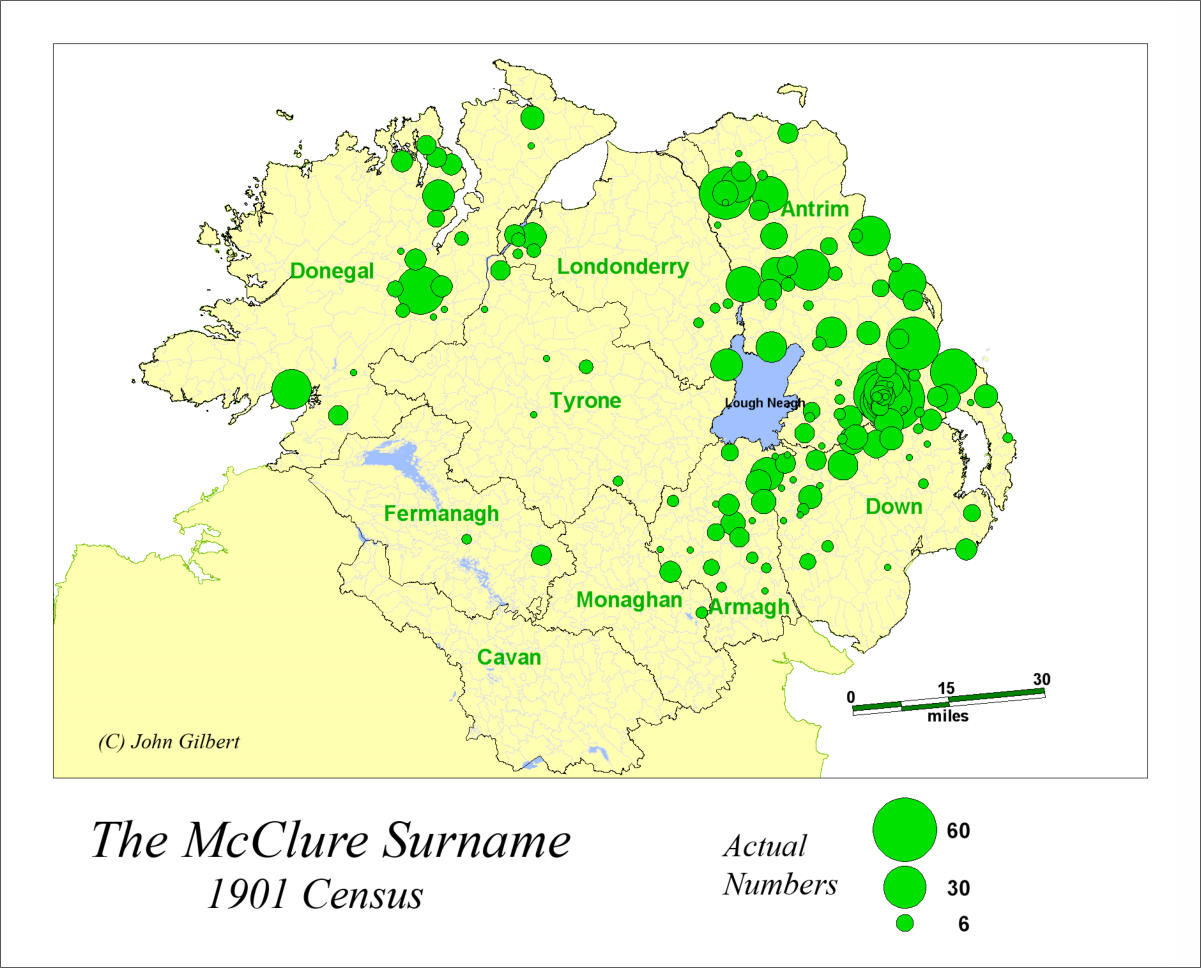
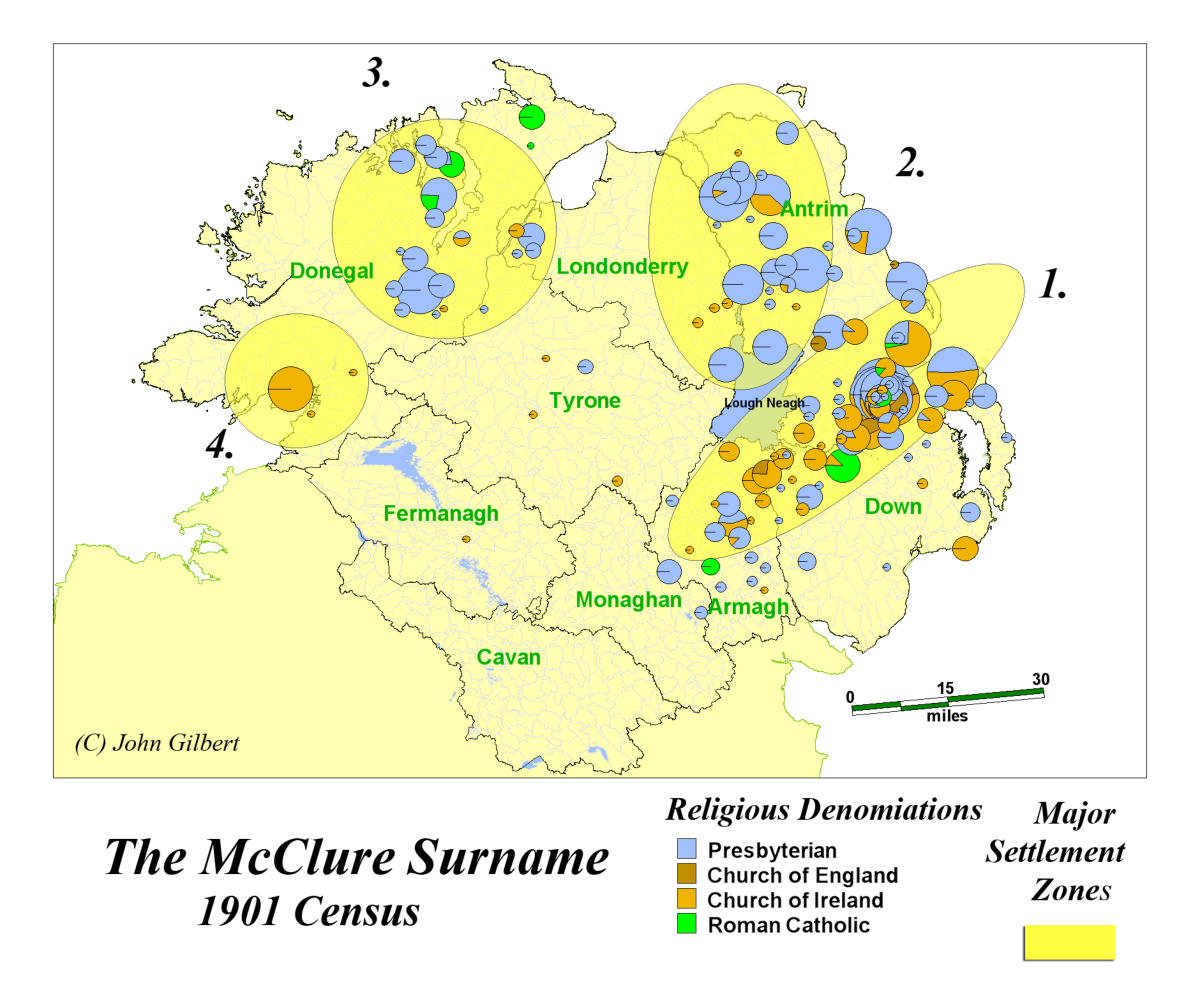
A map of the raw numbers of the McClure surname is
the starting point. 1524 McClures are found in Ulster.
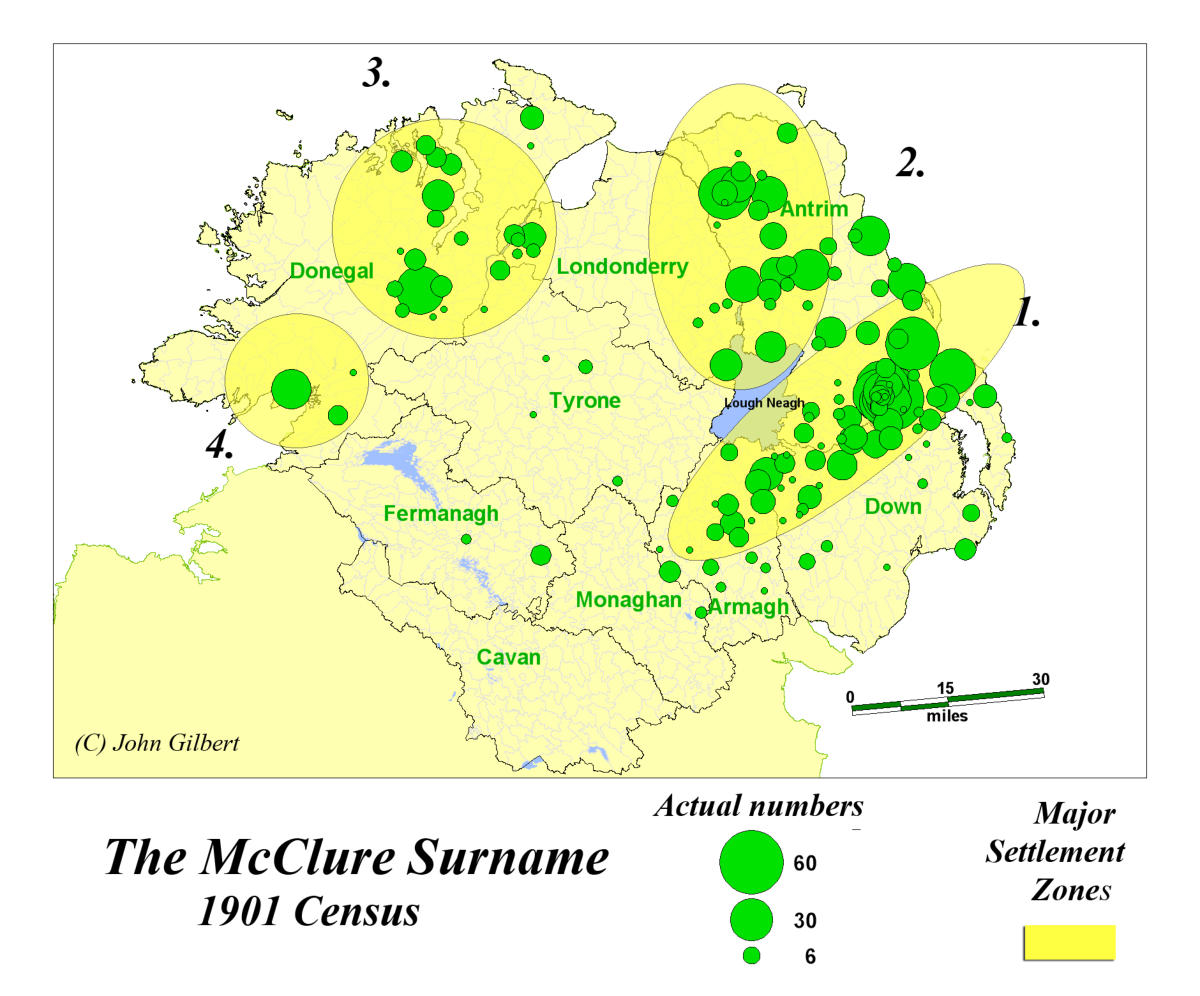
Broadly speaking four significant clusters can be
identified.
The region identified as #1 has at it’s core the port of
Belfast. 413 McClure’s, 27% of all individuals, are found
within a radius of 5 miles of Belfast. Two factors
contribute to this dominance. First is the proximity to
the coast of Ayrshire and Galloway where McClure’s are
found in large numbers. Two way migration between
Belfast and Scotland had been a factor since the
plantation (and before), resulting in growth of the
largest metropolitan region in Ulster. Secondly,
particularly since the 18th century, the draw of the city
as it industrialized has resulted in large scale emigration
from its immediate hinterland.
Area #2 is defined by Coleraine, the River Bann and the
Lough Neagh Basin. The region was settled planters in
the early 17th century attracted by it’s prime agricultural
land.
Area #3 is centred on Londonderry and Donegal. The
River Folye and Lough Swilly provided access to
Tyrone Londonderry and Donegal.
Area #4 is a minor concentration of the surname centred
on Donegal Bay in the SW of Donegal.
All four regions have a major port and river access to the
interior. These factors influenced the settlement of
planters and the McClure’s in the 17th century.
The regional concept can also be seen by examining the
religious structure of the McClure surname. Zones # 2
and # 3 are predominantly Presbyterian. Zones #1 and #
4 are entirely or predominantly Church of Ireland.
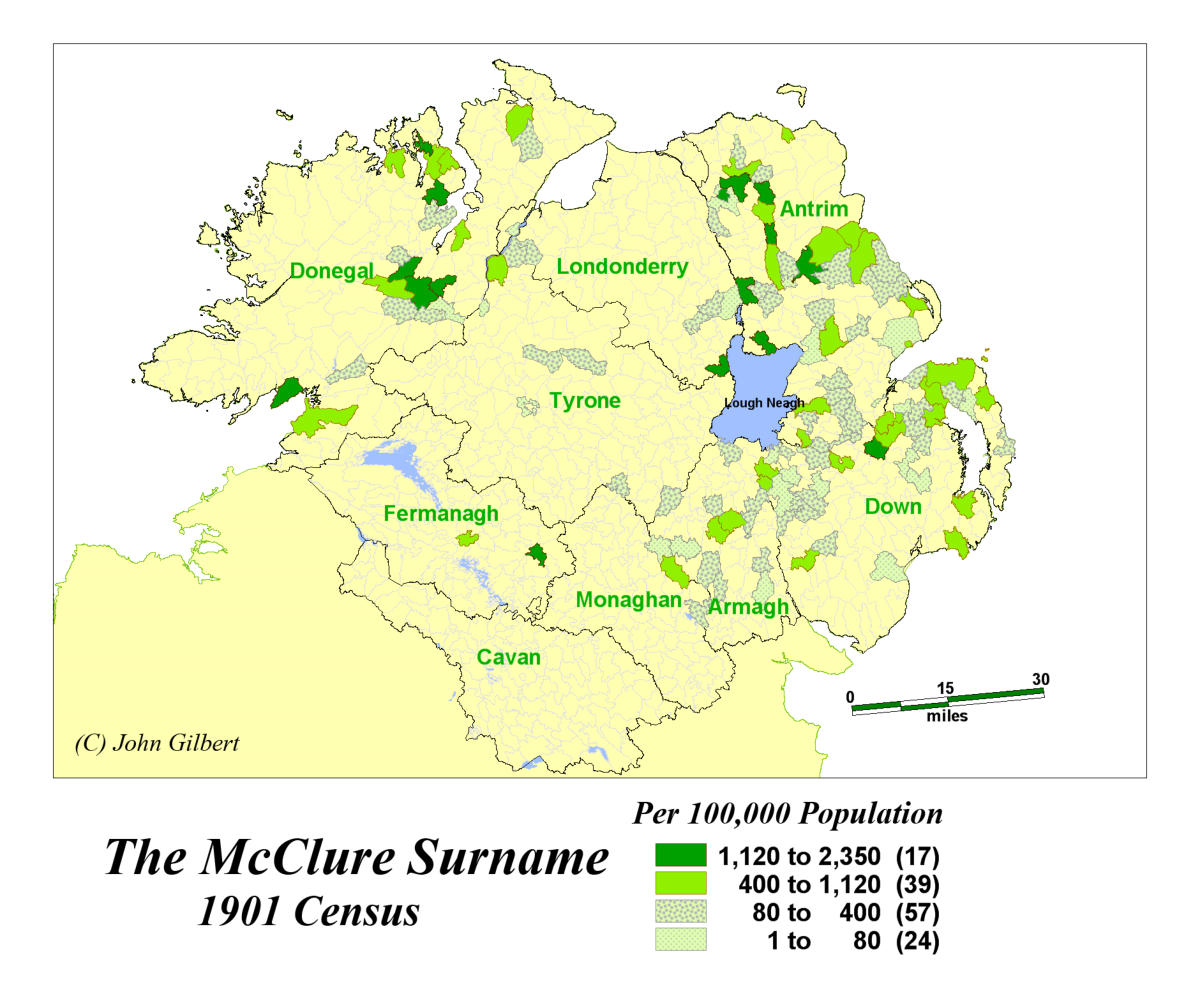
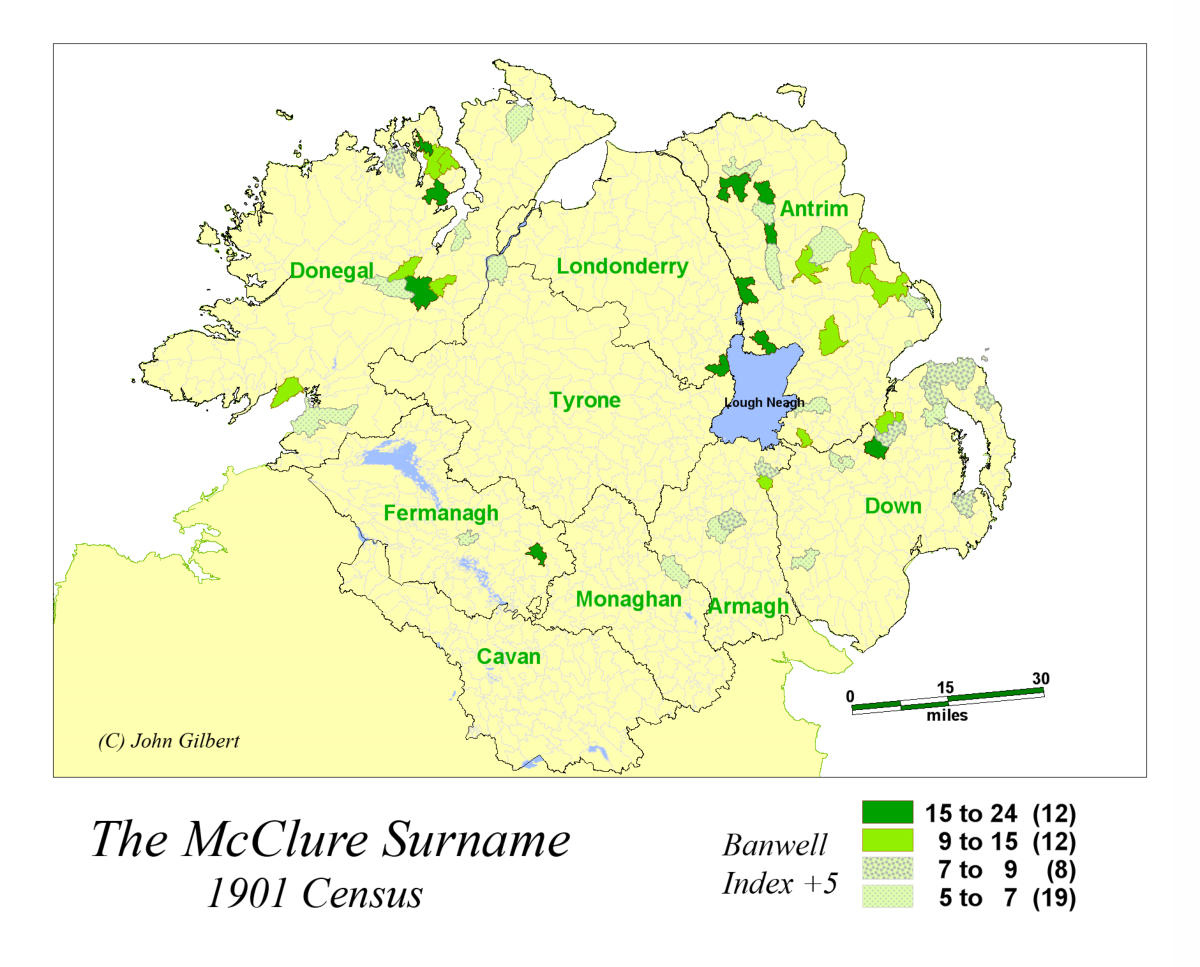
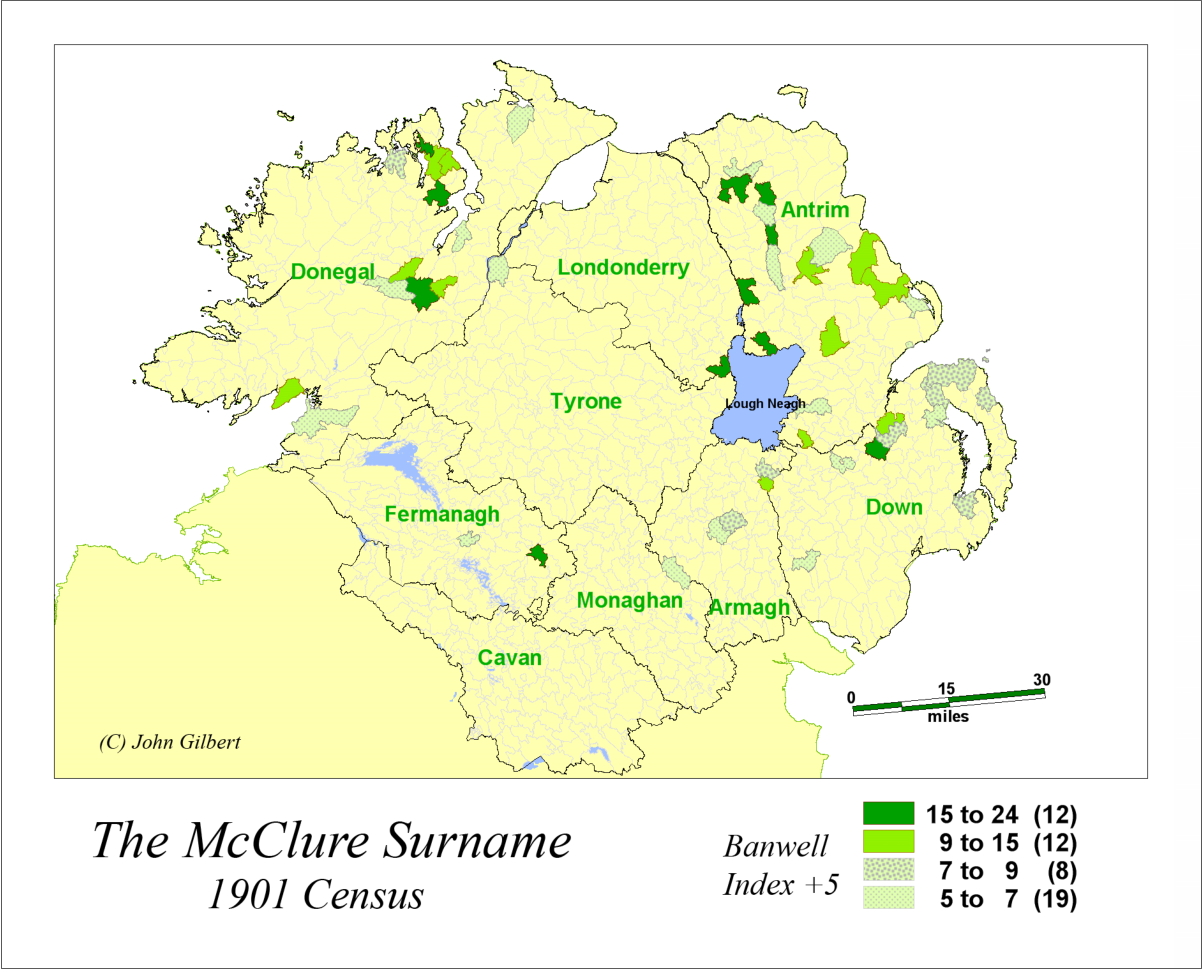
Surname Intensity:
We can begin to examine the structure of each area by
expressing the distribution as a relative measure. In this
case we can express the distribution of McClure’s per
100,000 population.
Areas with the highest intensity are likely the areas of
earliest settlement. Over time as opportunities arose,
individuals would relocate, usually to areas nearby that
they were familiar with, establishing secondary satellite
settlements. The Dark green areas represent the core
areas within each district. A second measure of intensity
can be calculated.
The Banwell Index compares the frequency of the
surname in a local area a (District Electoral Division),
with the frequency of the surname in a larger area, in
this case Ulster. The Index has been filtered to display
only those Electoral divisions in which the Banwell
Index is at least 5x the frequency of Ulster as a whole. In
the areas of Greatest intensity, the frequency of the
surname is between 15 and 24 times higher than in
Ulster. By using this measure we can significantly
reduce the probable zones of initial settlement.
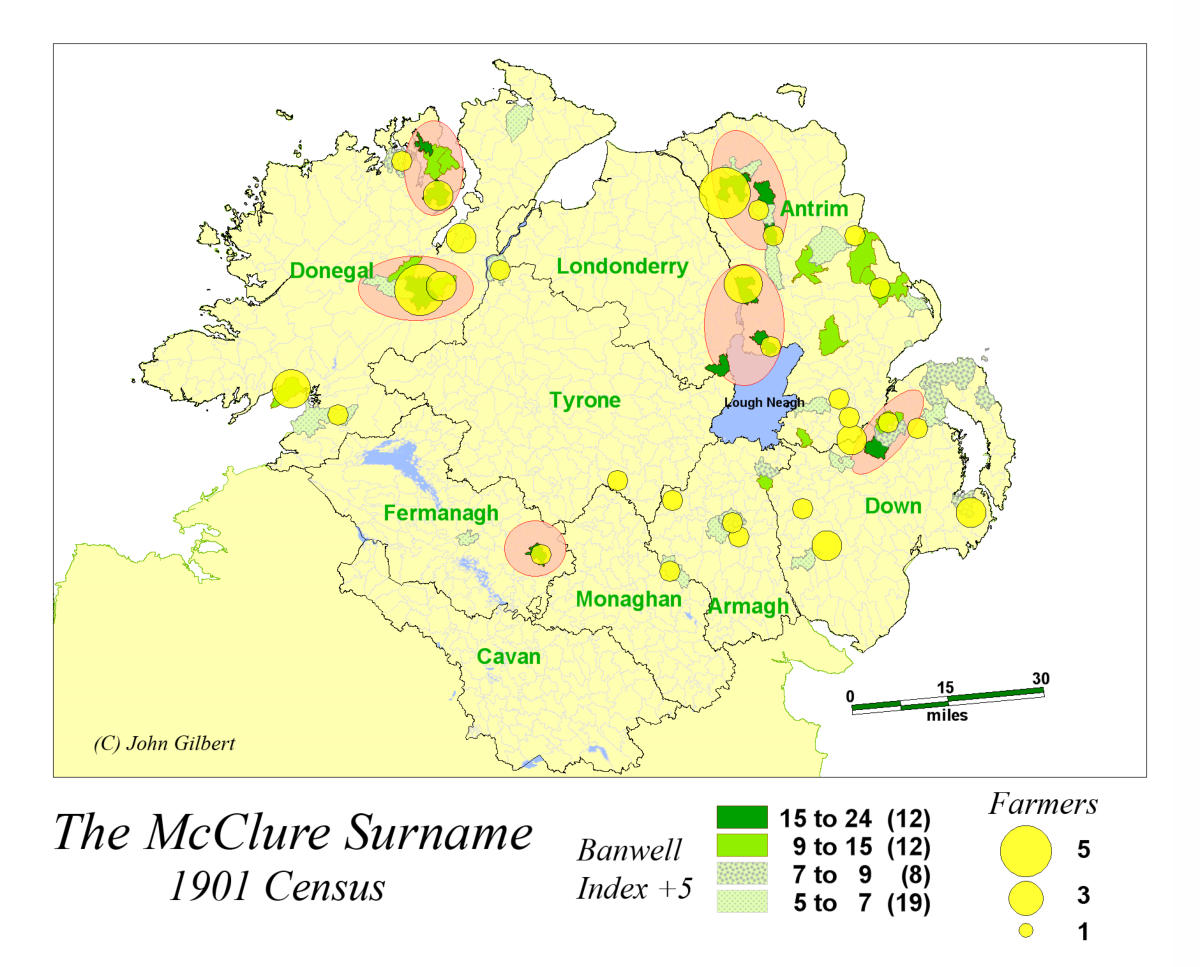
Occupational Structure
Further confirmation of the primacy of these regions can
be established by examining the occupational structure
of the McClure surname. Farmers are by far the most
stable elements in the population of Ulster, often
remaining in the same general region for generations. If
we filter out farmers from the 1525 McClure’s and plot
them on the map of highest intensity, they are generally
found close to areas where the Banwell index exceeds 5
times the national average.
Summary
The 1901 census is an invaluable tool that can be used to
isolate areas of long term settlement. Areas can be
identified with intensity indexes and occupational
structure. The next task will be to determine if the time
horizon can be extended back to the 16th century and
the plantation era. In the absence additional censuses or
parish records can approach this task by examining
census substitutes.
Return to Top
© John Gilbert
Created by SurnameOrigins


© John Gilbert Created by SurnameOrigins
McClure
Surname Origins

The 1901 Census
The study of the McClure surname in
Ulster begins with the 1901 Census.
Because of the four courts fire many
valuable genealogical resources were
lost. Fortunately the 1901 and 1910
Census survived and provide us with
a wide range of information which
may assist in identifying the areas of
early settlement in Ulster.
A map of the raw numbers of the
McClure surname is the starting
point. 1524 McClures are found in
Ulster. Broadly speaking four
significant clusters can be identified.
The region identified as #1 has at it’s
core the port of Belfast. 413
McClure’s, 27% of all individuals, are
found within a radius of 5 miles of
Belfast. Two factors contribute to this
dominance. First is the proximity to
the coast of Ayrshire and Galloway
where McClure’s are found in large
numbers. Two way migration
between Belfast and Scotland had
been a factor since the plantation
(and before), resulting in growth of
the largest metropolitan region in
Ulster. Secondly, particularly since
the 18th century, the draw of the city
as it industrialized has resulted in
large scale emigration from its
immediate hinterland.
Area #2 is defined by Coleraine, the
River Bann and the Lough Neagh
Basin. The region was settled planters
in the early 17th century attracted by
it’s prime agricultural land.
Area #3 is centred on Londonderry
and Donegal. The river Folye and
Lough Swilly provided access to
Tyrone Londonderry and Donegal.
Area #4 is a minor concentration of
the surname centred on Donegal Bay
in the SW of Donegal.
All four regions have a major port
and river access to the interior. These
factors influenced the settlement of
planters and the McClure’s in the
17th century.
The regional concept can also be seen
by examining the religious structure
of the McClure surname. Zones # 2
and # 3 are predominantly
Presbyterian. Zones #1 amd # 4 are
entirely or predominantly Church of
Ireland.
Surname Intensity:
We can begin to examine the structure of each area by expressing the distribution as a relative measure. In this case we can express the distribution of McClure’s per 100,000 population. Areas with the highest intensity are likely the areas of earliest settlement. Over time as opportunities arose, individuals would relocate, usually to areas nearby that they were familiar with, establishing secondary satellite settlements. The Dark green areas represent the core areas within each district. A second measure of intensity can be calculated. The Banwell Index compares the frequency of the surname in a local area a (District Electoral Division), with the frequency of the surname in a larger area, in this case Ulster. The Index has been filtered to display only those Electoral divisions in which the Banwell Index is at least 5x the frequency for Ulster as a whole. In the areas of Greatest intensity, the frequency of the surname is between 15 and 24 times higher than in Ulster. By using this measure we can significantly narrow the probable zones of initial settlement.Occupational Structure
Further confirmation of the primacy of these regions can be established by examining the occupational structure of the McClure surname. Farmers are by far the most stable elements in the population of Ulster, often remaining in the same general region for generations. If we filter out farmers from the 1525 McClure’s and then plot them on the map of highest intensity, they are generally found close to areas where the Banwell index is highest.Summary
The 1901 census is an invaluable tool that can be used to isolate areas of long term settlement. Areas can be identified with intensity indexes and occupational structure. The next task will be to determine if the time horizon can be extended back to the 16th century and the plantation era. In the absence additional censuses or parish records can approach this task by examining census substitutes.


McClure
Surname Origins