

The Kilpatrick Surname Study


© Holly Kilpatrick


The Kilpatrick Surname Study
Frequency and Distribution in Ulster
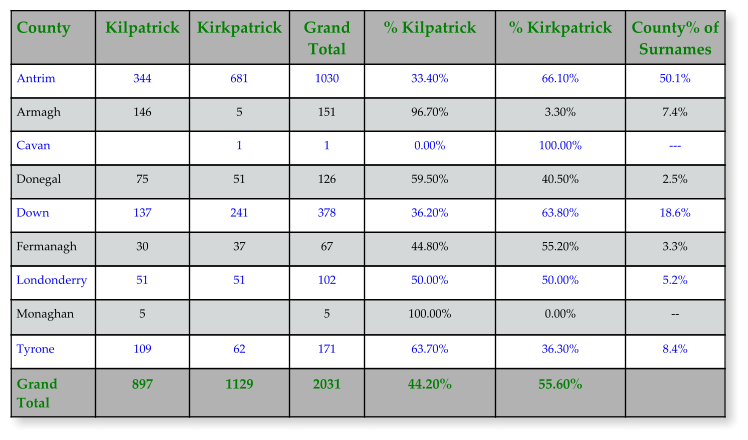
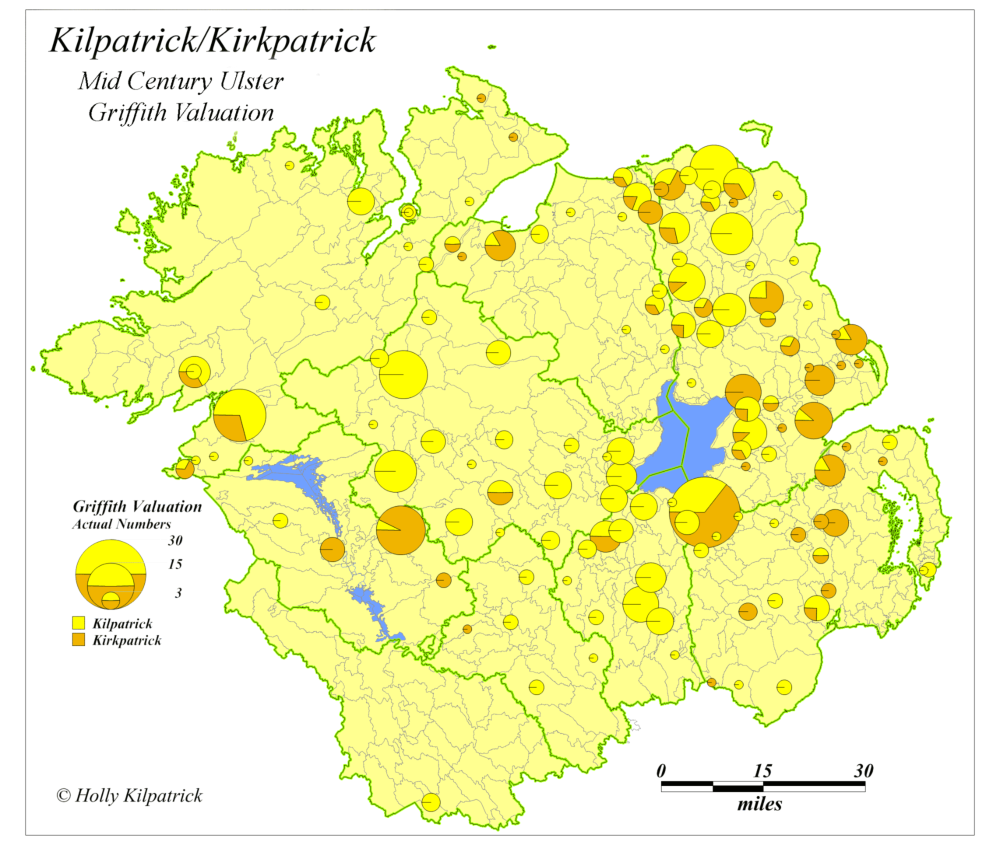
The settlement of the Kirkpatricks in Ulster, highly localized in Antrim and Down in the 1901 census, underscores the influence of proximity and accessibility to Scotland. The higher frequency of the Kilpatrick and Kirkpatrick surnames in northern Antrim compared to Down further suggests that factors such as transportation routes or historical settlement patterns played a role in shaping surname distributions within Ulster. Two approaches can be employed to display a surname’s distribution; the 1901 Census and the Griffith Valuation. The two distributions are approximately 40 years apart, which at first glance might favor the Griffith Valuation. The Griffith Valuation approach might be prefered, particularly if one is researching the mid 19th century; however the 1901 census is the prefered method for more general research. • Experience has shown that the two distributions are not that disimilar. • The 1901 Census has a finer degree of granulation , using the DED boundary as apposed to the larger Civil parish unit. • The 1901 census is a true census, recording all individuals, while the Valuation only records tenants. There is an approximate 5;1 ration of numbers favoring the census. • The 1901 census is comprehensive and inclused a wide range of personal information not present in the valuation.Intensity
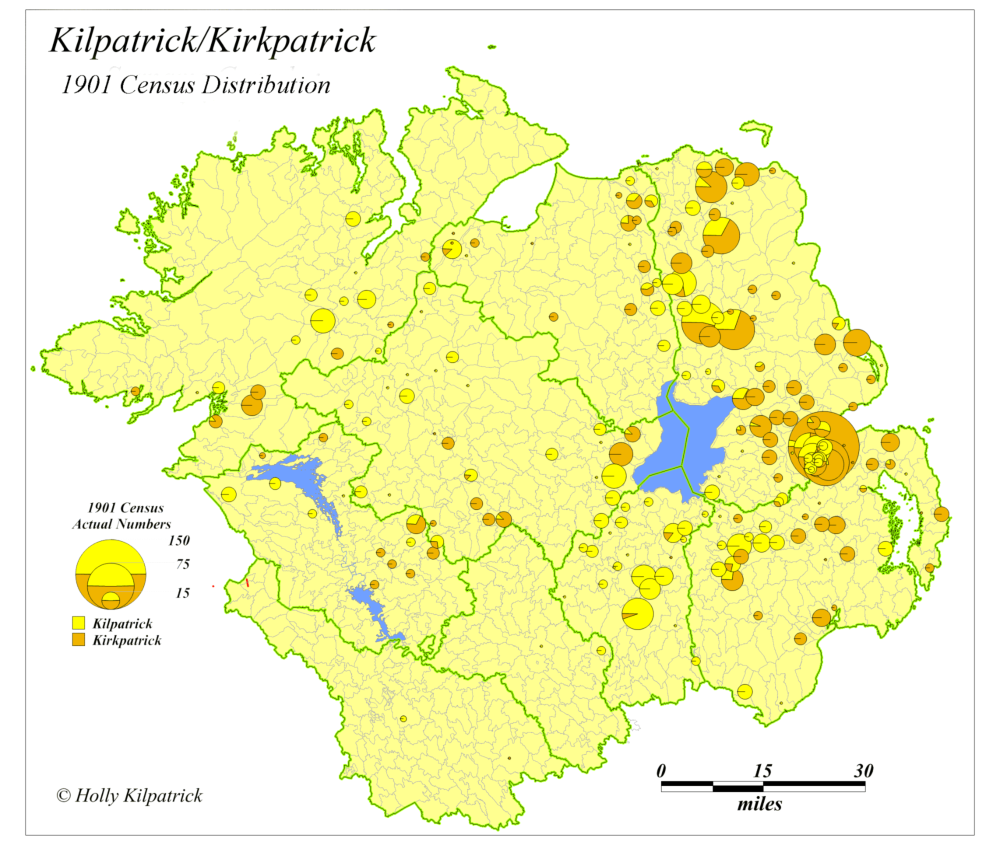
Both approaches measure absolute numbers, which, while meaningful, it is also useful to examine the relative concentration of a surname. Urban areas will tend to be overrepresented in the Valuation and Census, and underrepresented in rural areas. The solution is to standardize a distribution by expressing the surname’s frequency in relation to the population of the area in which they are found (DED, Civil Parish). On the map to the right, the Kilpatrick/Kirkpatrick surname distribution (aggregated), is expressed per 100,000 population. The darkest shading indicates the frequency of the surname may be as highAS 4.5 individuals per 1,000 population. Several additional observations can be deduced from the distribution displayed with this method: Numerous concentrations of the surname can be identified. The clusters express distance decay; as you move away from a core, the frequency per 100,000 declines. The cores likely represent initial settlements that, through time, have seen their frequency intensify. Adjacent, less populous DEDs likely involve movement by individuals over time, over short distances. Migration by the Kilpatricks and Kirkpatricks to Ulster took place at different times, resulting from a range of factors and circumstances. It is likely that regional core areas are independent from each other.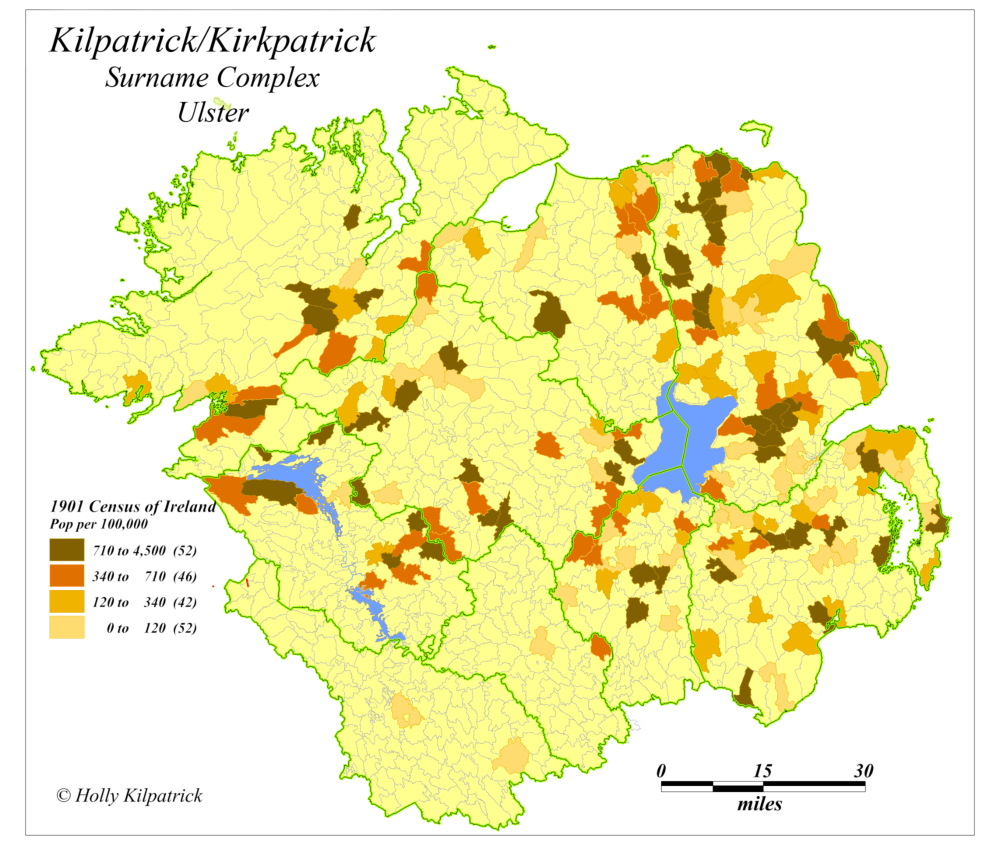
GeoGenealogy